
48. Irrelevance of Capital Structures with Complete Markets#
In addition to what’s in Anaconda, this lecture will need the following libraries:
!pip install --upgrade quantecon
!pip install kaleido
48.1. Introduction#
This is a prolegomenon to another lecture Equilibrium Capital Structures with Incomplete Markets about a model with incomplete markets authored by Bisin, Clementi, and Gottardi [Bisin et al., 2018].
We adopt specifications of preferences and technologies very close to Bisin, Clementi, and Gottardi’s but, unlike them, assume that there are complete markets in one-period Arrow securities.
This simplification of BCG’s setup helps us by
creating a benchmark economy to compare with outcomes in BCG’s incomplete markets economy
creating a good guess for initial values of some equilibrium objects to be computed in BCG’s incomplete markets economy via an iterative algorithm
illustrating classic complete markets outcomes that include
indeterminacy of consumers’ portfolio choices
indeterminacy of firms’ financial structures that underlies a Modigliani-Miller theorem [Modigliani and Miller, 1958]
introducing
Big K, little kissues in a simple context that will recur in the BCG incomplete markets environment
A Big K, little k analysis also played roles in this quantecon lecture as well as here and here.
48.1.1. Setup#
The economy lasts for two periods, \(t=0, 1\).
There are two types of consumers named \(i=1,2\).
A scalar random variable \(\epsilon\) with probability density \(g(\epsilon)\) affects both
the return in period \(1\) from investing \(k \geq 0\) in physical capital in period \(0\)
exogenous period \(1\) endowments of the consumption good for agents of types \(i =1\) and \(i=2\).
Type \(i=1\) and \(i=2\) agents’ period \(1\) endowments are correlated with the return on physical capital in different ways.
We discuss two arrangements:
a command economy in which a benevolent planner chooses \(k\) and allocates goods to the two types of consumers in each period and each random second period state
a competitive equilibrium with markets in claims on physical capital and a complete set (possibly a continuum) of one-period Arrow securities that pay period \(1\) consumption goods contingent on the realization of random variable \(\epsilon\).
48.1.2. Endowments#
There is a single consumption good in period \(0\) and at each random state \(\epsilon\) in period \(1\).
Economy-wide endowments in periods \(0\) and \(1\) are
Soon we’ll explain how aggregate endowments are divided between type \(i=1\) and type \(i=2\) consumers.
We don’t need to do that in order to describe a social planning problem.
48.1.3. Technology#
Where \(\alpha \in (0,1)\) and \(A >0\)
48.1.4. Preferences#
A consumer of type \(i\) orders period \(0\) consumption \(c_0^i\) and state \(\epsilon\), period \(1\) consumption \(c^i_1(\epsilon)\) by
\(\beta \in (0,1)\) and the one-period utility function is
48.1.5. Parameterizations#
Following BCG, we shall employ the following parameterizations:
Sometimes instead of assuming \(\epsilon \sim g(\epsilon) = {\mathcal N}(\mu,\sigma^2)\), we’ll assume that \(g(\cdot)\) is a probability mass function that serves as a discrete approximation to this normal density.
48.1.6. Pareto criterion and planning problem#
The planner’s objective function is
where \(\phi_i\) is the Pareto weight that the planner attaches to a consumer of type \(i\).
We form the following Lagrangian for the planner’s problem:
First-order necessary optimality conditions for the planning problem are:
The first four equations imply that
These together with the fifth first-order condition for the planner imply the following equation that determines an optimal choice of capital
for \(i = 1,2\).
48.1.7. Helpful observations and bookkeeping#
Evidently,
and
where it is to be understood that this equation holds for \(c^1 = c^1_0\) and \(c^2 = c^2_0\) and also for \(c^1 = c^1_1(\epsilon)\) and \(c^2 = c^2_1(\epsilon)\) for all \(\epsilon\).
With the same understanding, it follows that
Let \(c= c^1 + c^2\).
It follows from the preceding equation that
where \(\eta \in [0,1]\) is a function of \(\phi_1\) and \(\gamma\).
Consequently, we can write the planner’s first-order condition for \(k\) as
which is one equation to be solved for \(k \geq 0\).
Anticipating a Big K, little k idea widely used in macroeconomics, to be discussed in detail below, let \(K\) be the value of \(k\) that solves the preceding equation so that
The associated optimal consumption allocation is
where \(\eta \in [0,1]\) is the consumption share parameter mentioned above that is a function of the Pareto weight \(\phi_1\) and the utility curvature parameter \(\gamma\).
48.1.7.1. Remarks#
The consumption share parameter \(\eta\), which is determined by the Pareto weights, does not appear in equation (48.1) that determines \(K\).
Neither does it influence \(C_0\) or \(C_1(\epsilon)\), which depend solely on \(K\).
The role of \(\eta\) is to determine how to allocate total consumption between the two types of consumers.
Thus, the planner’s choice of \(K\) does not interact with how it wants to allocate consumption.
48.2. Competitive equilibrium#
We now describe a competitive equilibrium for an economy that has specifications of consumer preferences, technology, and aggregate endowments that are identical to those in the preceding planning problem.
While prices do not appear in the planning problem – only quantities do – prices play an important role in a competitive equilibrium.
To understand how the planning economy is related to a competitive equilibrium, we now turn to the Big K, little k distinction.
48.2.1. Measures of agents and firms#
We follow BCG in assuming that there are unit measures of
consumers of type \(i=1\)
consumers of type \(i=2\)
firms with access to the production technology that converts \(k\) units of time \(0\) good into \(A k^\alpha e^\epsilon\) units of the time \(1\) good in random state \(\epsilon\)
Thus, let \(\omega \in [0,1]\) index a particular consumer of type \(i\).
Then define Big \(C^i\) as
In the same spirit, let \(\zeta \in [0,1]\) index a particular firm.
Then define Big \(K\) as
The assumption that there are continua of our three types of agents plays an important role in making each individual agent into a powerless price taker:
an individual consumer chooses its own (infinitesimal) part \(c^i(\omega)\) of \(C^i\) taking prices as given
an individual firm chooses its own (infinitesimal) part \(k(\zeta)\) of \(K\) taking prices as given
equilibrium prices depend on the
Big K, Big Cobjects \(K\) and \(C\)
Nevertheless, in equilibrium, \(K = k\) and \(C^i = c^i\).
The assumption about measures of agents is thus a powerful device for making a host of competitive agents take as given equilibrium prices that are determined by the independent decisions of hosts of agents who behave just like they do.
48.2.1.1. Ownership#
Consumers of type \(i\) own the following exogenous quantities of the consumption good in periods \(0\) and \(1\):
where
Consumers also own shares in a firm that operates the technology for converting nonnegative amounts of the time \(0\) consumption good one-for-one into a capital good \(k\) that produces \(A k^\alpha e^\epsilon\) units of the time \(1\) consumption good in time \(1\) state \(\epsilon\).
Consumers of types \(i=1,2\) are endowed with \(\theta_0^i\) shares of a firm and
48.2.1.2. Asset markets#
At time \(0\), consumers trade the following assets with other consumers and with firms:
equities (also known as stocks) issued by firms
one-period Arrow securities that pay one unit of consumption at time \(1\) when the shock \(\epsilon\) assumes a particular value
Later, we’ll allow the firm to issue bonds too, but not now.
48.2.2. Objects appearing in a competitive equilibrium#
Let
\(a^i(\epsilon)\) be consumer \(i\)’s purchases of claims on time \(1\) consumption in state \(\epsilon\)
\(q(\epsilon)\) be a pricing kernel for one-period Arrow securities
\(\theta_0^i \geq 0\) be consumer \(i\)’s initial share of the firm, \(\sum_i \theta_0^i =1\)
\(\theta^i\) be the fraction of a firm’s shares purchased by consumer \(i\) at time \(t=0\)
\(V\) be the value of the representative firm
\(\tilde V\) be the value of equity issued by the representative firm
\(K, C_0\) be two scalars and \(C_1(\epsilon)\) a function that we use to construct a guess about an equilibrium pricing kernel for Arrow securities
We proceed to describe constrained optimum problems faced by consumers and a representative firm in a competitive equilibrium.
48.2.3. A representative firm’s problem#
A representative firm takes Arrow security prices \(q(\epsilon)\) as given.
The firm purchases capital \(k \geq 0\) from consumers at time \(0\) and finances itself by issuing equity at time \(0\).
The firm produces time \(1\) goods \(A k^\alpha e^\epsilon\) in state \(\epsilon\) and pays all of these earnings to owners of its equity.
The value of a firm’s equity at time \(0\) can be computed by multiplying its state-contingent earnings by their Arrow securities prices and then adding over all contingencies:
Owners of a firm want it to choose \(k\) to maximize
The firm’s first-order necessary condition for an optimal \(k\) is
The time \(0\) value of a representative firm is
The right side equals the value of equity minus the cost of the time \(0\) goods that it purchases and uses as capital.
48.2.4. A consumer’s problem#
We now pose a consumer’s problem in a competitive equilibrium.
As a price taker, each consumer faces a given Arrow securities pricing kernel \(q(\epsilon)\), a given value of a firm \(V\) that has chosen capital stock \(k\), a price of equity \(\tilde V\), and prospective next period random dividends \(A k^\alpha e^\epsilon\).
If we evaluate consumer \(i\)’s time \(1\) budget constraint at zero consumption \(c^i_1(\epsilon) = 0\) and solve for \(-a^i(\epsilon)\) we obtain
The quantity \(- \bar a^i(\epsilon;\theta^i)\) is the maximum amount that it is feasible for consumer \(i\) to repay to his Arrow security creditors at time \(1\) in state \(\epsilon\).
Notice that \(-\bar a^i(\epsilon;\theta^i)\) defined in (48.2) depends on
his endowment \(w_1^i(\epsilon)\) at time \(1\) in state \(\epsilon\)
his share \(\theta^i\) of a representative firm’s dividends
These constitute two sources of collateral that back the consumer’s issues of Arrow securities that pay off in state \(\epsilon\).
Consumer \(i\) chooses a scalar \(c_0^i\) and a function \(c_1^i(\epsilon)\) to maximize
subject to time \(0\) and time \(1\) budget constraints
Attach Lagrange multiplier \(\lambda_0^i\) to the budget constraint at time \(0\) and scaled Lagrange multiplier \(\beta \lambda_1^i(\epsilon) g(\epsilon)\) to the budget constraint at time \(1\) and state \(\epsilon\), then form the Lagrangian
Off corners, first-order necessary conditions for an optimum with respect to \(c_0^i, c_1^i(\epsilon),\) and \(a^i(\epsilon)\) are
These equations imply that consumer \(i\) adjusts its consumption plan to satisfy
To deduce a restriction on equilibrium prices, we solve the period \(1\) budget constraint to express \(a^i(\epsilon)\) as
then substitute the expression on the right side into the time \(0\) budget constraint and rearrange to get the single intertemporal budget constraint
The right side of inequality (48.4) is the present value of consumer \(i\)’s consumption while the left side is the present value of consumer \(i\)’s endowment when consumer \(i\) buys \(\theta^i\) shares of equity.
From inequality (48.4), we deduce two findings.
1. No-arbitrage condition
Unless
an arbitrage opportunity would be open.
If
the consumer could afford an arbitrarily high present value of consumption by setting \(\theta^i\) to an arbitrarily large negative number.
If
the consumer could afford an arbitrarily high present value of consumption by setting \(\theta^i\) to an arbitrarily large positive number.
Since resources are finite, there can exist no such arbitrage opportunity in a competitive equilibrium.
Therefore, it must be true that the following no-arbitrage condition prevails:
Equation (48.5) asserts that the value of equity equals the value of the state-contingent dividends \(Ak^\alpha e^\epsilon\) evaluated at the Arrow security prices \(q(\epsilon; K)\), which we shall express as a function of \(K\) in (48.6) below.
We’ll say more about this equation later.
2. Indeterminacy of portfolio
When the no-arbitrage pricing equation (48.5) prevails, a consumer of type \(i\)’s choice \(\theta^i\) of equity is indeterminate.
Consumer of type \(i\) can offset any choice of \(\theta^i\) by setting an appropriate schedule \(a^i(\epsilon)\) for purchasing state-contingent securities.
48.2.5. Computing competitive equilibrium prices and quantities#
Having computed an allocation that solves the planning problem, we can readily compute a competitive equilibrium via the following steps that, as we’ll see, rely heavily on the Big K, little k, Big C, little c logic mentioned earlier:
a competitive equilibrium allocation equals the allocation chosen by the planner
competitive equilibrium prices and the value of a firm’s equity are encoded in shadow prices from the planning problem that depend on Big \(K\) and Big \(C\).
To substantiate that this procedure is valid, we proceed as follows.
With \(K\) in hand, we make the following guess for competitive equilibrium Arrow securities prices
To confirm the guess, we begin by considering its consequences for the firm’s choice of \(k\).
With Arrow securities prices (48.6), the firm’s first-order necessary condition for choosing \(k\) becomes
which can be verified to be satisfied if the firm sets
because by setting \(k=K\) equation (48.7) becomes equivalent with the planner’s first-order condition (48.1) for setting \(K\).
To pose a consumer’s problem in a competitive equilibrium, we require not only the above guess for the Arrow securities pricing kernel \(q(\epsilon)\) but also the value of equity \(\tilde V\):
Let \(\tilde V\) be the value of equity implied by Arrow securities price function (48.6) and formula (48.8).
At the Arrow securities prices \(q(\epsilon)\) given by (48.6) and equity value \(\tilde V\) given by (48.8), consumers \(i=1,2\) choose consumption allocations and portfolios that satisfy the first-order necessary conditions
It can be verified directly that the following choices satisfy these equations
for an \(\eta \in (0,1)\) that depends on consumers’ endowments \([w_0^1, w_0^2, w_1^1(\epsilon), w_1^2(\epsilon), \theta_0^1, \theta_0^2 ]\).
Remark: Multiple arrangements of endowments \([w_0^1, w_0^2, w_1^1(\epsilon), w_1^2(\epsilon), \theta_0^1, \theta_0^2 ]\) are associated with the same distribution of wealth \(\eta\).
Can you explain why?
Hint
Consumer \(i\)’s budget constraint (48.4) depends on the endowments \(w_0^i, \theta_0^i, w_1^i(\epsilon)\) only through their present value \(w_0^i + \theta_0^i V + \int w_1^i(\epsilon) q(\epsilon) d\epsilon\).
48.2.6. Modigliani-Miller theorem#
We now allow a firm to issue both bonds and equity.
Payouts from equity and bonds, respectively, are
Thus, one unit of the bond pays one unit of consumption at time \(1\) in state \(\epsilon\) if \(A k^\alpha e^\epsilon - b \geq 0\), which is true when \(\epsilon \geq \epsilon^* = \log \frac{b}{Ak^\alpha}\), and pays \(\frac{A k^\alpha e^\epsilon}{b}\) units of time \(1\) consumption in state \(\epsilon\) when \(\epsilon < \epsilon^*\).
The market value of the firm’s securities is now the sum of the value of its equity and the value of its bonds, which we denote
where \(p(k,b)\) is the price of one unit of the bond when a firm with \(k\) units of physical capital issues \(b\) bonds.
We continue to assume that there are complete markets in Arrow securities with pricing kernel \(q(\epsilon)\).
A version of the no-arbitrage-in-equilibrium argument that we presented earlier implies that the value of equity and the price of bonds are
Consequently, the market value of the firm’s securities is
which is the same expression that we obtained above when we assumed that the firm issued only equity.
Owners still choose \(k\) to maximize the value of the firm net of its capital outlay, \(V = -k + \tilde V + p(k,b) b\).
Because \(\tilde V + p(k,b) b\) does not depend on \(b\), the first-order condition for \(k\) is again (48.7).
We thus obtain a version of the celebrated Modigliani-Miller theorem [Modigliani and Miller, 1958] about firms’ finance:
Modigliani-Miller theorem:
The value of a firm is independent of the mix of equity and bonds that it uses to finance its physical capital.
The firm’s decision about how much physical capital to purchase does not depend on whether it finances those purchases by issuing bonds or equity.
The firm’s choice of whether to finance itself by issuing equity or bonds is indeterminate.
Please note the role of the assumption of complete markets in Arrow securities in substantiating these claims.
In Equilibrium Capital Structures with Incomplete Markets, we will assume that markets are (very) incomplete – we’ll shut down markets in almost all Arrow securities.
That will pull the rug from underneath the Modigliani-Miller theorem.
48.3. Code#
We create a class object BCG_complete_markets to compute equilibrium allocations of the complete market BCG model given a list of parameter values.
It consists of 4 functions that do the following things:
opt_kcomputes the planner’s optimal capital \(K\)It uses a Newton-secant root finder, started at \(k = 0.01\), to find the \(k\) that solves the planner’s first-order necessary condition (48.1), written as
\[ \beta \alpha A k^{\alpha -1} \int \left( \frac{w_1(\epsilon) + A k^\alpha e^\epsilon}{w_0 - k } \right)^{-\gamma} e^\epsilon g(\epsilon) d \epsilon - 1 = 0 \]where the integral is computed by Gauss-Hermite quadrature.
When called with
plot=True, it also plots the left side of this equation on a grid of values of \(k\).
qcomputes the ratio of Arrow security prices to probabilities as a function of the productivity shock \(\epsilon\) and capital \(K\):\[ \frac{q(\epsilon;K)}{g(\epsilon)} = \beta \frac{u'\left( w_1(\epsilon) + A K^\alpha e^\epsilon\right)} {u'(w_0 - K )} \]so the Arrow price \(q(\epsilon;K)\) in (48.6) equals
qtimes the density \(g(\epsilon)\).Vsolves for the firm value given capital \(k\), evaluating Arrow prices at \(K = k\):\[ V = - k + \int A k^\alpha e^\epsilon q(\epsilon; K) d \epsilon = - k + \int A k^\alpha e^\epsilon \frac{q(\epsilon; K)}{g(\epsilon)} g(\epsilon) d \epsilon \]where the second integral, an expectation with respect to \(g\), is computed by Gauss-Hermite quadrature.
opt_ccomputes optimal consumptions \(c^i_0\) and \(c^i_1(\epsilon)\):The function first computes weight \(\eta\) using the budget constraint for agent 1:
\[ w_0^1 + \theta_0^1 V + \int w_1^1(\epsilon) q(\epsilon) d \epsilon = c_0^1 + \int c_1^1(\epsilon) q(\epsilon) d \epsilon = \eta \left( C_0 + \int C_1(\epsilon) q(\epsilon) d \epsilon \right) \]where
\[ \begin{aligned} C_0 & = w_0 - K \cr C_1(\epsilon) & = w_1(\epsilon) + A K^\alpha e^\epsilon \cr \end{aligned} \]It computes consumption for each agent as
\[ \begin{aligned} c_0^1 & = \eta C_0 \cr c_0^2 & = (1 - \eta) C_0 \cr c_1^1(\epsilon) & = \eta C_1 (\epsilon) \cr c_1^2 (\epsilon) & = (1 - \eta) C_1(\epsilon) \end{aligned} \]
The list of parameters includes:
\(\chi_1\), \(\chi_2\): loadings of the log endowments of agents 1 and 2 on the shock \(\epsilon\). Default values are 0 and 0.9, respectively.
\(w^1_0\), \(w^2_0\): Initial endowments. Default values are 1.
\(\theta^1_0\), \(\theta^2_0\): Consumers’ initial shares of a representative firm. Default values are 0.5.
\(\psi\): CRRA risk parameter, denoted \(\gamma\) in the text above. Default value is 3.
\(\alpha\): Capital share (curvature) parameter of the production function. Default value is 0.6.
\(A\): Productivity of technology. Default value is 2.5.
\(\mu\), \(\sigma\): Mean and standard deviation of the log of the shock. Default values are -0.025 and 0.4, respectively.
\(\beta\): time preference discount factor. Default value is 0.96.
nb_points_integ: number of points used for integration through Gauss-Hermite quadrature: default value is 10
import numpy as np
import matplotlib.pyplot as plt
from scipy.stats import norm
from numba import njit, prange
from quantecon.optimize import root_finding
#=========== Class: BCG for complete markets ===========#
class BCG_complete_markets:

    # init method or constructor
    def __init__(self,
                 𝜒1 = 0,
                 𝜒2 = 0.9,
                 w10 = 1,
                 w20 = 1,
                 𝜃10 = 0.5,
                 𝜃20 = 0.5,
                 𝜓 = 3,
                 𝛼 = 0.6,
                 A = 2.5,
                 𝜇 = -0.025,
                 𝜎 = 0.4,
                 𝛽 = 0.96,
                 nb_points_integ = 10):

        #=========== Setup ===========#
        # Risk parameters
        self.𝜒1 = 𝜒1
        self.𝜒2 = 𝜒2

        # Other parameters (𝜓 is the CRRA parameter 𝛾 in the text)
        self.𝜓 = 𝜓
        self.𝛼 = 𝛼
        self.A = A
        self.𝜇 = 𝜇
        self.𝜎 = 𝜎
        self.𝛽 = 𝛽

        # Production
        self.f = njit(lambda k: A * (k ** 𝛼))
        self.Y = lambda 𝜖, k: np.exp(𝜖) * self.f(k)

        # Initial endowments
        self.w10 = w10
        self.w20 = w20
        self.w0 = w10 + w20

        # Initial holdings
        self.𝜃10 = 𝜃10
        self.𝜃20 = 𝜃20

        # Endowments at t=1
        w11 = njit(lambda 𝜖: np.exp(-𝜒1*𝜇 - 0.5*(𝜒1**2)*(𝜎**2) + 𝜒1*𝜖))
        w21 = njit(lambda 𝜖: np.exp(-𝜒2*𝜇 - 0.5*(𝜒2**2)*(𝜎**2) + 𝜒2*𝜖))
        self.w11 = w11
        self.w21 = w21

        self.w1 = njit(lambda 𝜖: w11(𝜖) + w21(𝜖))

        # Normal PDF
        self.g = lambda x: norm.pdf(x, loc=𝜇, scale=𝜎)

        # Integration
        x, self.weights = np.polynomial.hermite.hermgauss(nb_points_integ)
        self.points_integral = np.sqrt(2) * 𝜎 * x + 𝜇

        self.k_foc = k_foc_factory(self)

    #=========== Optimal k ===========#
    # Function: solve for optimal k
    def opt_k(self, plot=False):
        w0 = self.w0

        # Plot FONC for k on a grid
        if plot:
            kgrid = np.linspace(1e-4, w0-1e-4, 100)
            kfoc_list = [self.k_foc(k, self.𝜒1, self.𝜒2) for k in kgrid]

            fig, ax = plt.subplots(figsize=(8,7))
            ax.plot(kgrid, kfoc_list, color='blue', label=r'FONC for k')
            ax.axhline(0, color='red', linestyle='--')
            ax.legend()
            ax.set_xlabel(r'k')
            plt.show()

        # Find k that solves the FONC
        kk = root_finding.newton_secant(self.k_foc, 1e-2, args=(self.𝜒1, self.𝜒2)).root

        return kk

    #=========== Arrow security price ===========#
    # Function: Compute Arrow security price
    def q(self,𝜖,k):
        𝛽 = self.𝛽
        𝜓 = self.𝜓
        w0 = self.w0
        w1 = self.w1
        fk = self.f(k)

        # Returns 𝛽 u'(C_1(𝜖))/u'(C_0), i.e., the Arrow price q(𝜖;K) divided by g(𝜖)
        return 𝛽 * ((w1(𝜖) + np.exp(𝜖)*fk) / (w0 - k))**(-𝜓)


    #=========== Firm value V ===========#
    # Function: compute firm value V
    def V(self, k):
        q = self.q
        fk = self.f(k)
        weights = self.weights
        integ = lambda 𝜖: np.exp(𝜖) * fk * q(𝜖, k)

        return -k + (weights @ integ(self.points_integral)) / np.sqrt(np.pi)

    #=========== Optimal c ===========#
    # Function: Compute optimal consumption choices c
    def opt_c(self, k=None, plot=False):
        w1 = self.w1
        w0 = self.w0
        w10 = self.w10
        w11 = self.w11
        𝜃10 = self.𝜃10
        Y = self.Y
        q = self.q
        V = self.V
        weights = self.weights

        if k is None:
            k = self.opt_k()

        # Solve for the ratio of consumption 𝜂 from the intertemporal B.C.
        fk = self.f(k)

        c1 = lambda 𝜖: (w1(𝜖) + np.exp(𝜖)*fk)*q(𝜖,k)
        denom = (weights @ c1(self.points_integral)) / np.sqrt(np.pi) + (w0 - k)

        w11q = lambda 𝜖: w11(𝜖)*q(𝜖,k)
        num = w10 + 𝜃10 * V(k) + (weights @ w11q(self.points_integral)) / np.sqrt(np.pi)

        𝜂 = num / denom

        # Consumption choices
        c10 = 𝜂 * (w0 - k)
        c20 = (1-𝜂) * (w0 - k)
        c11 = lambda 𝜖: 𝜂 * (w1(𝜖)+Y(𝜖,k))
        c21 = lambda 𝜖: (1-𝜂) * (w1(𝜖)+Y(𝜖,k))

        return c10, c20, c11, c21


def k_foc_factory(model):
    𝜓 = model.𝜓
    f = model.f
    𝛽 = model.𝛽
    𝛼 = model.𝛼
    A = model.A
    w0 = model.w0
    𝜇 = model.𝜇
    𝜎 = model.𝜎

    weights = model.weights
    points_integral = model.points_integral

    w11 = njit(lambda 𝜖, 𝜒1: np.exp(-𝜒1*𝜇 - 0.5*(𝜒1**2)*(𝜎**2) + 𝜒1*𝜖))
    w21 = njit(lambda 𝜖, 𝜒2: np.exp(-𝜒2*𝜇 - 0.5*(𝜒2**2)*(𝜎**2) + 𝜒2*𝜖))
    w1 = njit(lambda 𝜖, 𝜒1, 𝜒2: w11(𝜖, 𝜒1) + w21(𝜖, 𝜒2))

    @njit
    def integrand(𝜖, 𝜒1, 𝜒2, k=1e-4):
        fk = f(k)
        return (w1(𝜖, 𝜒1, 𝜒2) + np.exp(𝜖) * fk) ** (-𝜓) * np.exp(𝜖)

    @njit
    def k_foc(k, 𝜒1, 𝜒2):
        int_k = (weights @ integrand(points_integral, 𝜒1, 𝜒2, k=k)) / np.sqrt(np.pi)

        mul = 𝛽 * 𝛼 * A * k ** (𝛼 - 1) / ((w0 - k) ** (-𝜓))
        val = mul * int_k - 1

        return val

    return k_foc
48.3.1. Examples#
Below we provide some examples of how to use BCG_complete_markets.
48.3.1.1. First example#
In the first example, we set up instances of BCG complete markets models.
We can use either default parameter values or set parameter values as we want.
The two instances of the BCG complete markets model, mdl1 and mdl2, represent the model with default parameter settings and with the loading of agent 2’s endowment on the shock altered to be \(\chi_2 = -0.9\), respectively.
# Example: BCG model for complete markets
mdl1 = BCG_complete_markets()
mdl2 = BCG_complete_markets(𝜒2=-0.9)
Let’s plot the agents’ time-1 endowments as functions of the shock to see how the two models differ.
#==== Figure 1: HH endowments and firm productivity ====#
# Realizations of innovation from -1 to 1
epsgrid = np.linspace(-1,1,1000)


fig, ax = plt.subplots(1,2,figsize=(14,6))
ax[0].plot(epsgrid, mdl1.w11(epsgrid), color='black', label="Agent 1's endowment")
ax[0].plot(epsgrid, mdl1.w21(epsgrid), color='blue', label="Agent 2's endowment")
ax[0].plot(epsgrid, mdl1.Y(epsgrid,1), color='red', label=r'Production with $k=1$')
ax[0].set_xlim([-1,1])
ax[0].set_ylim([0,7])
ax[0].set_xlabel(r'$\epsilon$',fontsize=12)
ax[0].set_title(r'Model with $\chi_1 = 0$, $\chi_2 = 0.9$')
ax[0].legend()
ax[0].grid()

ax[1].plot(epsgrid, mdl2.w11(epsgrid), color='black', label="Agent 1's endowment")
ax[1].plot(epsgrid, mdl2.w21(epsgrid), color='blue', label="Agent 2's endowment")
ax[1].plot(epsgrid, mdl2.Y(epsgrid,1), color='red', label=r'Production with $k=1$')
ax[1].set_xlim([-1,1])
ax[1].set_ylim([0,7])
ax[1].set_xlabel(r'$\epsilon$',fontsize=12)
ax[1].set_title(r'Model with $\chi_1 = 0$, $\chi_2 = -0.9$')
ax[1].legend()
ax[1].grid()

plt.show()
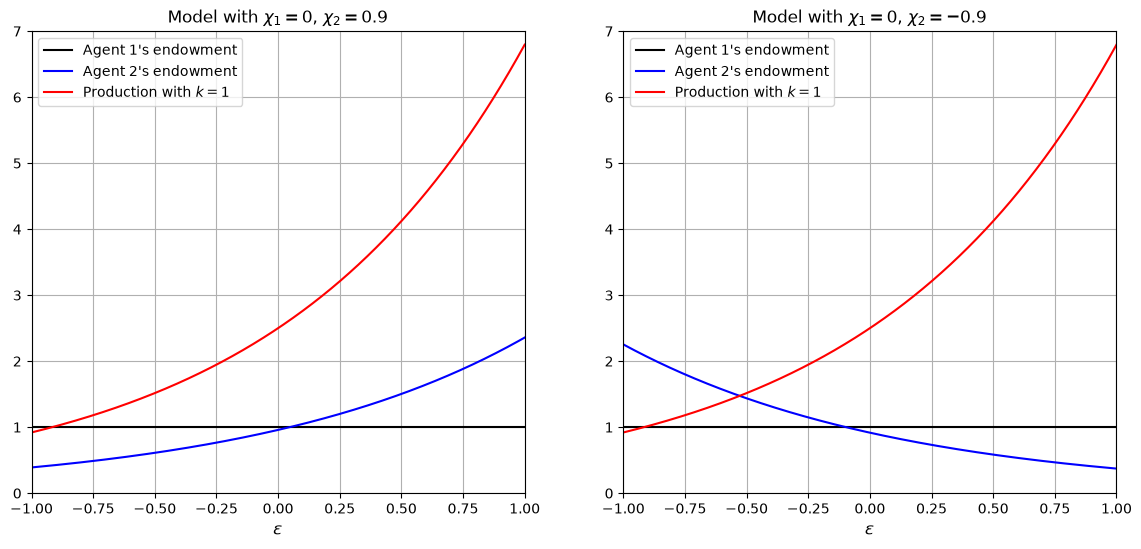
Let’s also compare the optimal capital stock, \(k\), and optimal time-0 consumption of agent 2, \(c^2_0\), for the two models:
# Print optimal k
kk_1 = mdl1.opt_k()
kk_2 = mdl2.opt_k()

print('The optimal k for model 1: {:.5f}'.format(kk_1))
print('The optimal k for model 2: {:.5f}'.format(kk_2))

# Print optimal time-0 consumption for agent 2
c20_1 = mdl1.opt_c(k=kk_1)[1]
c20_2 = mdl2.opt_c(k=kk_2)[1]

print('The optimal c20 for model 1: {:.5f}'.format(c20_1))
print('The optimal c20 for model 2: {:.5f}'.format(c20_2))
The optimal k for model 1: 0.14235
The optimal k for model 2: 0.13791
The optimal c20 for model 1: 0.90205
The optimal c20 for model 2: 0.92862
48.3.1.2. Second example#
In the second example, we illustrate how the optimal choice of \(k\) is influenced by the loadings \(\chi_i\) of endowments on the shock.
We will need to install the plotly package for 3D illustration.
See https://plotly.com/python/getting-started/ for further instructions.
# Mesh grid of 𝜒
N = 30
𝜒1grid, 𝜒2grid = np.meshgrid(np.linspace(-1,1,N),
                             np.linspace(-1,1,N))

k_foc = k_foc_factory(mdl1)

# Create grid for k
kgrid = np.zeros_like(𝜒1grid)

@njit(parallel=True)
def fill_k_grid(kgrid):
    # Loop: Compute optimal k and
    for i in prange(N):
        for j in prange(N):
            X1 = 𝜒1grid[i, j]
            X2 = 𝜒2grid[i, j]
            k = root_finding.newton_secant(k_foc, 1e-2, args=(X1, X2)).root
            kgrid[i, j] = k
%%time
fill_k_grid(kgrid)
CPU times: user 1.4 s, sys: 11.8 ms, total: 1.41 s
Wall time: 1.41 s
%%time
# Second-run
fill_k_grid(kgrid)
CPU times: user 6.33 ms, sys: 10 μs, total: 6.34 ms
Wall time: 2.08 ms
#=== Example: Plot optimal k with different loadings ===#

from IPython.display import Image
# Import plotly
import plotly.graph_objs as go

# Plot optimal k
fig = go.Figure(data=[go.Surface(x=𝜒1grid, y=𝜒2grid, z=kgrid)])
fig.update_layout(scene = dict(xaxis_title='x - 𝜒1',
                               yaxis_title='y - 𝜒2',
                               zaxis_title='z - k',
                               aspectratio=dict(x=1,y=1,z=1)))
fig.update_layout(width=500,
                  height=500,
                  margin=dict(l=50, r=50, b=65, t=90))
fig.update_layout(scene_camera=dict(eye=dict(x=2, y=-2, z=1.5)))

# Export to PNG file
Image(fig.to_image(format="png", engine="kaleido"))
# fig.show() will provide interactive plot when running
# notebook locally
/tmp/ipykernel_5884/3359419994.py:19: DeprecationWarning:
Support for the 'engine' argument is deprecated and will be removed after September 2025.
Kaleido will be the only supported engine at that time.

  Image(fig.to_image(format="png", engine="kaleido"))
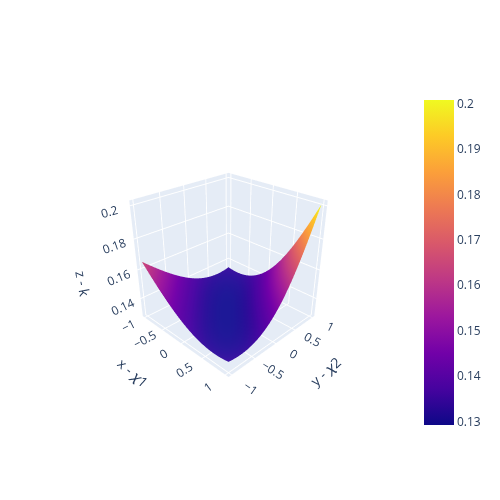
The optimal \(k\) is smallest, about \(0.129\), near \(\chi_1 = \chi_2 = 0\), where second-period endowments are riskless.
It rises as endowments load on the shock in either direction, and it is largest, about \(0.201\), at \(\chi_1 = \chi_2 = 1\), where endowment risk reinforces productivity risk.
When the loadings have opposite signs, as at \(\chi_1 = -\chi_2 = \pm 1\), the two endowments partly offset one another and \(k\) is only about \(0.134\).
This pattern is consistent with a precautionary motive: riskier second-period endowments raise the expected marginal utility of second-period consumption and with it the incentive to carry resources into period \(1\) by accumulating capital.
48.4. Exercises#
Exercise 48.1
This exercise verifies the Modigliani-Miller theorem numerically at the equilibrium computed by BCG_complete_markets.
Note that the method q(𝜖, k) of BCG_complete_markets returns \(\beta u'(C_1(\epsilon))/u'(C_0)\), so the Arrow price density that appears in the formulas for \(\tilde V\) and \(p(k,b)\) is q(𝜖, K) * g(𝜖).
Using the default parameters, compute \(K\) and, for \(b \in \{0.01, 0.2, 0.5, 0.8, 1.2, 2.0\}\), compute the default threshold \(\epsilon^*\), the value of equity \(\tilde V\), the bond price \(p(K,b)\), the value of debt \(p(K,b) b\), and the market value of the firm’s securities \(\tilde V + p(K,b) b\).
Holding Arrow prices fixed at \(q(\epsilon;K)\), let a firm that has promised to issue \(b\) bonds choose \(k\) to maximize \(-k + \tilde V(k,b) + p(k,b) b\). Show that its optimal \(k\) does not depend on \(b\).
Hint: because the payoffs \(d^e\) and \(d^b\) have a kink at \(\epsilon^*\), integrate with scipy.integrate.quad on either side of \(\epsilon^*\) rather than with the lecture’s Gauss-Hermite nodes.
Solution
Here is one solution.
from scipy.integrate import quad
from scipy.optimize import minimize_scalar

mdl = BCG_complete_markets()
K = mdl.opt_k()
lo, hi = mdl.𝜇 - 10 * mdl.𝜎, mdl.𝜇 + 10 * mdl.𝜎

def arrow_price(𝜖, K):
    "Arrow price density q(𝜖;K) = 𝛽 u'(C_1)/u'(C_0) g(𝜖)"
    return mdl.q(𝜖, K) * mdl.g(𝜖)

def equity_bond_values(k, b, K):
    "Value of equity and price of a bond for a firm with (k, b), at prices q(.;K)"
    Y = mdl.f(k)
    𝜖_star = np.log(b / Y)
    Vtilde = quad(lambda 𝜖: (Y * np.exp(𝜖) - b) * arrow_price(𝜖, K),
                  max(𝜖_star, lo), hi)[0]
    p = (quad(lambda 𝜖: Y * np.exp(𝜖) / b * arrow_price(𝜖, K),
              lo, min(𝜖_star, hi))[0]
         + quad(lambda 𝜖: arrow_price(𝜖, K), max(𝜖_star, lo), hi)[0])
    return Vtilde, p

print(f"K = {K:.5f},  A K^alpha = {mdl.f(K):.4f}")
print(f"{'b':>6} {'eps*':>8} {'Vtilde':>9} {'p':>8} {'p*b':>8} {'Vtilde+p*b':>11}")
for b in [0.01, 0.2, 0.5, 0.8, 1.2, 2.0]:
    Vt, p = equity_bond_values(K, b, K)
    print(f"{b:6.2f} {np.log(b/mdl.f(K)):8.3f} {Vt:9.5f} {p:8.5f} {p*b:8.5f} {Vt + p*b:11.6f}")

print(f"\nPrice of a riskless claim, int q: {quad(lambda e: arrow_price(e, K), lo, hi)[0]:.5f}")

# Optimal k for different leverage levels, prices held fixed at q(.;K)
for b in [0.01, 0.5, 1.2]:
    obj = lambda k: -(-k + sum(np.array(equity_bond_values(k, b, K)) * np.array([1, b])))
    res = minimize_scalar(obj, bounds=(0.02, 0.6), method='bounded',
                          options={'xatol': 1e-7})
    print(f"b = {b:4.2f}: argmax_k [-k + Vtilde + p b] = {res.x:.5f}")
K = 0.14235,  A K^alpha = 0.7762
     b     eps*    Vtilde        p      p*b  Vtilde+p*b
  0.01   -4.352   0.23348  0.37710  0.00377    0.237247
  0.20   -1.356   0.16185  0.37701  0.07540    0.237247
  0.50   -0.440   0.06208  0.35033  0.17516    0.237247
  0.80    0.030   0.01622  0.27629  0.22103    0.237247
  1.20    0.436   0.00231  0.19578  0.23494    0.237247
  2.00    0.947   0.00006  0.11860  0.23719    0.237247

Price of a riskless claim, int q: 0.37710
b = 0.01: argmax_k [-k + Vtilde + p b] = 0.14235
b = 0.50: argmax_k [-k + Vtilde + p b] = 0.14235
b = 1.20: argmax_k [-k + Vtilde + p b] = 0.14235
Several things stand out.
As \(b\) rises from \(0.01\) to \(2\), the default threshold \(\epsilon^*\) rises from about \(-4.35\) to about \(0.95\), so default goes from essentially impossible to more likely than not.
The value of equity falls from \(0.2335\) to almost zero and the bond price falls from \(0.3771\) to \(0.1186\), but the market value of the firm’s securities \(\tilde V + p b\) equals \(0.237247\) for every \(b\).
That number equals \(K + V\) from the lecture’s V method: \(0.14235 + 0.09490\).
When \(b\) is small the bond is effectively riskless, so its price equals the price \(\int q(\epsilon;K) d\epsilon = 0.3771\) of a sure unit of time \(1\) consumption.
The firm’s optimal \(k\) is \(0.14235 = K\) whatever \(b\) is.
The economics is that with complete Arrow markets, equity and debt are simply two bundles of Arrow securities whose payoffs add up to \(A k^\alpha e^\epsilon\) in every state.
Because Arrow securities are priced linearly, how the firm slices its output between the two bundles cannot change the value of the total, and therefore cannot change the \(k\) that maximizes \(-k\) plus that value.
Exercise 48.2
This exercise studies how the planner’s (and the competitive equilibrium’s) capital \(K\) responds to risk aversion and to risk.
Define the stochastic discount factor \(m(\epsilon) = \beta u'(C_1(\epsilon))/u'(C_0)\), the gross riskless rate \(R_f = 1/E[m]\), and the marginal gross return on capital \(R_k(\epsilon) = \alpha A K^{\alpha-1} e^\epsilon\).
Condition (48.1) says \(E[m R_k] = 1\), which implies \(E[R_k] - R_f = -R_f \, \textrm{cov}(m, R_k)\).
For \(\psi \in \{1.5, 2, 3, 4, 6\}\), holding other parameters at their defaults, compute \(K\), \(R_f\), \(E[R_k]\), \(E[R_k]-R_f\) and \(\textrm{cov}(m,R_k)\).
Do the same for \(\sigma \in \{0.05, 0.2, 0.4, 0.6, 0.8\}\), setting \(\mu = -\sigma^2/2\) so that \(E[e^\epsilon] = 1\) and each increase in \(\sigma\) is a mean-preserving spread in \(e^\epsilon\) (and in each \(w_1^i(\epsilon)\)).
Do the same for \(\chi_2 \in \{-0.9, 0, 0.9\}\) at the default parameters.
Plot \(K\) as a function of \(\psi\) and of \(\sigma\) and explain what you find.
Solution
Here is one solution.
def expect(mdl, h):
    "E[h(𝜖)] under N(𝜇, 𝜎^2) by Gauss-Hermite quadrature"
    return mdl.weights @ h(mdl.points_integral) / np.sqrt(np.pi)

def summarize(mdl):
    K = mdl.opt_k()
    m = lambda 𝜖: mdl.q(𝜖, K)                 # stochastic discount factor
    Rf = 1 / expect(mdl, m)                     # gross riskless rate
    MPK = lambda 𝜖: mdl.𝛼 * mdl.f(K) / K * np.exp(𝜖)   # marginal return on capital
    ER = expect(mdl, MPK)                       # expected marginal return
    cov = expect(mdl, lambda 𝜖: m(𝜖) * MPK(𝜖)) - expect(mdl, m) * ER
    return K, Rf, ER, cov

print("Varying 𝜓 (𝜎 = 0.4)")
print(f"{'𝜓':>5} {'K':>8} {'Rf':>7} {'E[R_k]':>8} {'E[R_k]-Rf':>10} {'cov(m,R_k)':>11}")
for 𝜓 in [1.5, 2, 3, 4, 6]:
    K, Rf, ER, cov = summarize(BCG_complete_markets(𝜓=𝜓, nb_points_integ=20))
    print(f"{𝜓:5.1f} {K:8.5f} {Rf:7.4f} {ER:8.4f} {ER-Rf:10.4f} {cov:11.5f}")

print("\nMean-preserving spreads: 𝜇 = -𝜎^2/2 so that E[exp(𝜖)] = 1 (𝜓 = 3)")
print(f"{'𝜎':>5} {'K':>8} {'Rf':>7} {'E[R_k]':>8} {'E[R_k]-Rf':>10} {'cov(m,R_k)':>11}")
for 𝜎 in [0.05, 0.2, 0.4, 0.6, 0.8]:
    K, Rf, ER, cov = summarize(BCG_complete_markets(𝜎=𝜎, 𝜇=-𝜎**2/2, nb_points_integ=20))
    print(f"{𝜎:5.2f} {K:8.5f} {Rf:7.4f} {ER:8.4f} {ER-Rf:10.4f} {cov:11.5f}")

print("\nVarying 𝜒2 (𝜓 = 3, 𝜎 = 0.4, 𝜇 = -0.025)")
for 𝜒2 in [-0.9, 0, 0.9]:
    K, Rf, ER, cov = summarize(BCG_complete_markets(𝜒2=𝜒2, nb_points_integ=20))
    print(f"{𝜒2:5.1f} {K:8.5f} {Rf:7.4f} {ER:8.4f} {ER-Rf:10.4f} {cov:11.5f}")

𝜓_grid = np.linspace(1.2, 8, 15)
K_𝜓 = [BCG_complete_markets(𝜓=𝜓).opt_k() for 𝜓 in 𝜓_grid]
𝜎_grid = np.linspace(0.05, 0.8, 15)
K_𝜎 = [BCG_complete_markets(𝜎=𝜎, 𝜇=-𝜎**2/2).opt_k() for 𝜎 in 𝜎_grid]

fig, ax = plt.subplots(1, 2, figsize=(12, 4.5))
ax[0].plot(𝜓_grid, K_𝜓)
ax[0].set_xlabel(r'$\psi$')
ax[0].set_ylabel(r'$K$')
ax[1].plot(𝜎_grid, K_𝜎)
ax[1].set_xlabel(r'$\sigma$  (with $\mu = -\sigma^2/2$)')
ax[1].set_ylabel(r'$K$')
plt.tight_layout()
plt.show()
print("K strictly decreasing in 𝜓:", np.all(np.diff(K_𝜓) < 0))
print("K strictly increasing in 𝜎:", np.all(np.diff(K_𝜎) > 0))
Varying 𝜓 (𝜎 = 0.4)
    𝜓        K      Rf   E[R_k]  E[R_k]-Rf  cov(m,R_k)
  1.5  0.26725  2.3141   2.6867     0.3725    -0.16097
  2.0  0.20517  2.4696   2.9863     0.5167    -0.20920
  3.0  0.14235  2.6518   3.4565     0.8047    -0.30345
  4.0  0.11231  2.7210   3.8003     1.0793    -0.39667
  6.0  0.08628  2.6655   4.2228     1.5573    -0.58423

Mean-preserving spreads: 𝜇 = -𝜎^2/2 so that E[exp(𝜖)] = 1 (𝜓 = 3)
    𝜎        K      Rf   E[R_k]  E[R_k]-Rf  cov(m,R_k)
 0.05  0.13494  3.3273   3.3423     0.0150    -0.00450
 0.20  0.13651  3.1010   3.3267     0.2258    -0.07280
 0.40  0.14083  2.5282   3.2856     0.7574    -0.29959
 0.60  0.14593  1.9054   3.2391     1.3337    -0.69995
 0.80  0.14977  1.3964   3.2057     1.8093    -1.29572

Varying 𝜒2 (𝜓 = 3, 𝜎 = 0.4, 𝜇 = -0.025)
 -0.9  0.13791  3.4869   3.5006     0.0137    -0.00392
  0.0  0.12923  3.1696   3.5928     0.4232    -0.13351
  0.9  0.14235  2.6518   3.4565     0.8047    -0.30345
K strictly decreasing in 𝜓: True
K strictly increasing in 𝜎: True
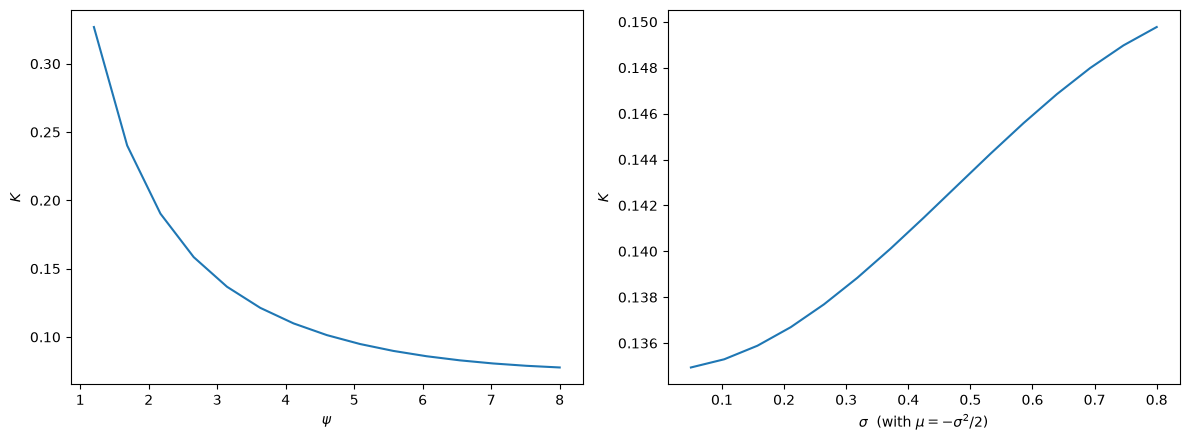
In every row, \(E[R_k] - R_f = -R_f \, \textrm{cov}(m, R_k)\), as it must: for example, at the default parameters \(2.6518 \times 0.30345 = 0.8047\).
Risk aversion.
\(K\) falls steadily as \(\psi\) rises, from \(0.267\) at \(\psi = 1.5\) to \(0.086\) at \(\psi = 6\).
In this economy consumption is expected to grow (\(C_1\) is on average well above \(C_0 \approx 1.86\)), so a larger \(\psi\), which in this time-separable specification also means a smaller elasticity of intertemporal substitution, makes consumers less willing to postpone consumption.
At the same time, the risk premium on capital rises from \(0.37\) to \(1.56\) because capital pays off most in states where consumption is high.
Both forces lower \(K\).
\(R_f\) is not monotone in \(\psi\): it rises from \(2.31\) to \(2.72\) and then falls back to \(2.67\) at \(\psi = 6\), as the precautionary motive, which grows with \(\psi\), starts to offset the consumption-smoothing motive.
Risk.
With mean-preserving spreads, \(K\) rises with \(\sigma\), from \(0.1349\) at \(\sigma = 0.05\) to \(0.1498\) at \(\sigma = 0.8\).
A larger \(\sigma\) raises the risk premium from \(0.015\) to \(1.81\), which by itself discourages investment.
But it also strengthens the precautionary saving motive so much that \(R_f\) falls from \(3.33\) to \(1.40\).
Since capital is the only way to move goods from period \(0\) to period \(1\) in the aggregate, the precautionary motive wins and \(E[R_k]\) (equal to \(\alpha A K^{\alpha-1} E[e^\epsilon]\)) must fall from \(3.34\) to \(3.21\), which requires more capital.
Loadings of endowments on the productivity shock.
\(K\) is lowest at \(\chi_2 = 0\) (\(0.1292\)), when the aggregate endowment \(w_1(\epsilon) = 2\) is riskless.
With \(\chi_2 = -0.9\), agent 2’s endowment hedges output, so capital is almost riskless in terms of marginal utility: the risk premium is only \(0.014\) and, although \(R_f = 3.49\) is higher than at \(\chi_2 = 0\), the required expected return \(E[R_k] = 3.50\) is lower than at \(\chi_2 = 0\) (\(3.59\)), so \(K = 0.1379\) is higher.
With \(\chi_2 = 0.9\), the endowment amplifies aggregate risk: the risk premium is largest (\(0.80\)) but \(R_f\) is lowest (\(2.65\)), and \(K = 0.1424\) is highest.
Exercise 48.3
The lecture remarks that multiple arrangements of endowments \([w_0^1, w_0^2, w_1^1(\epsilon), w_1^2(\epsilon), \theta_0^1, \theta_0^2]\) are associated with the same distribution of wealth \(\eta\).
Verify this numerically: starting from the default parameters, reassign all shares of the firm to agent 1 (and, separately, to agent 2), and offset the change by transferring time \(0\) endowment so that \(w_0^i + \theta_0^i V\) is unchanged for each \(i\). Report \(K\), \(\eta\), and the Pareto weight \(\phi_1\) that the planner would need to attach to agent 1 to implement the same allocation. Also report what happens if all shares go to agent 1 without an offsetting transfer.
Illustrate portfolio indeterminacy: at the default equilibrium, for \(\theta^1 \in \{0, 0.5, 1, -1\}\) compute the Arrow security holdings \(a^1(\epsilon)\) that deliver agent 1’s equilibrium consumption \(c_1^1(\epsilon)\), and show that the time \(0\) cost \(\int q(\epsilon) a^1(\epsilon) d\epsilon + \theta^1 \tilde V\) of the portfolio does not depend on \(\theta^1\).
Plot \(\beta u'(C_1(\epsilon))/u'(C_0)\) and the Arrow price density \(q(\epsilon;K)\) for \(\chi_2 = 0.9\) and \(\chi_2 = -0.9\), and explain their shapes.
Solution
Here is one solution.
def expect(mdl, h):
    return mdl.weights @ h(mdl.points_integral) / np.sqrt(np.pi)

base = BCG_complete_markets()
K = base.opt_k()
V = base.V(K)
print(f"K = {K:.5f}, V = {V:.5f}")

# Part 1: endowment arrangements with the same distribution of wealth
arrangements = {
    "baseline (θ10=0.5, w10=1)":        dict(𝜃10=0.5, 𝜃20=0.5, w10=1.0, w20=1.0),
    "agent 1 owns the firm":            dict(𝜃10=1.0, 𝜃20=0.0, w10=1-0.5*V, w20=1+0.5*V),
    "agent 2 owns the firm":            dict(𝜃10=0.0, 𝜃20=1.0, w10=1+0.5*V, w20=1-0.5*V),
    "agent 1 owns firm, no offset":     dict(𝜃10=1.0, 𝜃20=0.0, w10=1.0, w20=1.0),
}
𝜓 = base.𝜓
for name, kw in arrangements.items():
    mdl = BCG_complete_markets(**kw)
    k = mdl.opt_k()
    c10, c20, c11, c21 = mdl.opt_c(k=k)
    𝜂 = c10 / (mdl.w0 - k)
    𝜙1 = 𝜂**𝜓 / (𝜂**𝜓 + (1 - 𝜂)**𝜓)
    print(f"{name:32s} K = {k:.5f}  eta = {𝜂:.5f}  phi_1 = {𝜙1:.5f}")

# Part 2: two portfolios that finance agent 1's same consumption plan
c10, c20, c11, c21 = base.opt_c(k=K)
m = lambda 𝜖: base.q(𝜖, K)
Vtilde = V + K
for 𝜃 in [0.0, 0.5, 1.0, -1.0]:
    a = lambda 𝜖: c11(𝜖) - base.w11(𝜖) - 𝜃 * base.Y(𝜖, K)   # Arrow purchases
    cost = expect(base, lambda 𝜖: m(𝜖) * a(𝜖)) + 𝜃 * Vtilde
    print(f"theta1 = {𝜃:5.2f}: time-0 cost of portfolio = {cost:.6f}, "
          f"implied c10 = {base.w10 + base.𝜃10*V - cost:.6f}")

# Part 3: Arrow price densities for chi2 = 0.9 and -0.9
epsgrid = np.linspace(-1.5, 1.5, 400)
fig, ax = plt.subplots(1, 2, figsize=(12, 4.5))
for chi2, ls in [(0.9, '-'), (-0.9, '--')]:
    mdl = BCG_complete_markets(𝜒2=chi2)
    Kc = mdl.opt_k()
    ax[0].plot(epsgrid, mdl.q(epsgrid, Kc), ls, label=rf'$\chi_2 = {chi2}$')
    ax[1].plot(epsgrid, mdl.q(epsgrid, Kc) * mdl.g(epsgrid), ls, label=rf'$\chi_2 = {chi2}$')
    print(f"chi2 = {chi2:4.1f}: m(-1) = {mdl.q(-1.0, Kc):.4f}, m(0) = {mdl.q(0.0, Kc):.4f}, "
          f"m(1) = {mdl.q(1.0, Kc):.4f}, m(-1)/m(1) = {mdl.q(-1.0, Kc)/mdl.q(1.0, Kc):.3f}")
ax[0].set_title(r"$\beta\, u'(C_1(\epsilon))/u'(C_0)$")
ax[1].set_title(r"Arrow price density $q(\epsilon;K)$")
for a_ in ax:
    a_.set_xlabel(r'$\epsilon$')
    a_.legend()
plt.tight_layout()
plt.show()
K = 0.14235, V = 0.09490
baseline (θ10=0.5, w10=1)        K = 0.14235  eta = 0.51441  phi_1 = 0.54314
agent 1 owns the firm            K = 0.14235  eta = 0.51441  phi_1 = 0.54314
agent 2 owns the firm            K = 0.14235  eta = 0.51441  phi_1 = 0.54314
agent 1 owns firm, no offset     K = 0.14235  eta = 0.53155  phi_1 = 0.59365
theta1 =  0.00: time-0 cost of portfolio = 0.091850, implied c10 = 0.955600
theta1 =  0.50: time-0 cost of portfolio = 0.091850, implied c10 = 0.955600
theta1 =  1.00: time-0 cost of portfolio = 0.091850, implied c10 = 0.955600
theta1 = -1.00: time-0 cost of portfolio = 0.091850, implied c10 = 0.955600
chi2 =  0.9: m(-1) = 1.3089, m(0) = 0.3009, m(1) = 0.0377, m(-1)/m(1) = 34.764
chi2 = -0.9: m(-1) = 0.1404, m(0) = 0.3227, m(1) = 0.1519, m(-1)/m(1) = 0.924
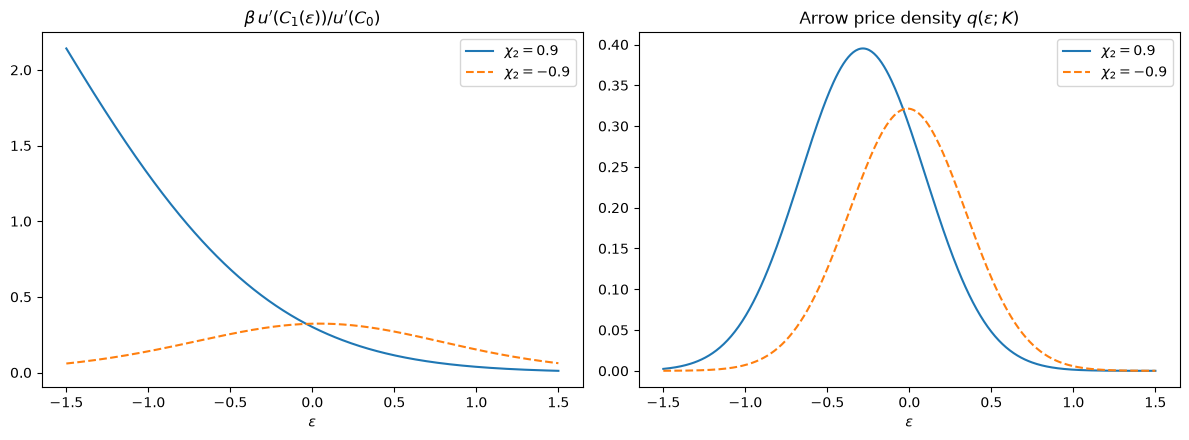
Wealth distribution.
From the formula for \(\eta\) in opt_c, \(\eta\) is the ratio of agent 1’s wealth \(w_0^1 + \theta_0^1 V + \int w_1^1(\epsilon) q(\epsilon) d\epsilon\) to aggregate wealth.
Consequently, any rearrangement of endowments that leaves each agent’s present value unchanged leaves \(\eta = 0.51441\) unchanged, and with it the implied Pareto weight \(\phi_1 = \eta^\psi / (\eta^\psi + (1-\eta)^\psi) = 0.54314\).
Handing agent 1 all shares without an offsetting transfer raises agent 1’s wealth by \(0.5 V\) and raises \(\eta\) to \(0.53155\) and \(\phi_1\) to \(0.59365\).
In all four cases \(K = 0.14235\): as the planning problem showed, \(K\) does not depend on the distribution of wealth.
Portfolio indeterminacy.
Each of the four portfolios costs \(0.091850\) at time \(0\) and leaves agent 1 with the same \(c_0^1 = 0.955600\).
Holding more equity simply means buying fewer Arrow securities, because equity is itself a bundle of Arrow securities priced at (48.8).
Pricing kernel.
With \(\chi_2 = 0.9\), aggregate time \(1\) consumption rises with \(\epsilon\), so the discount factor falls steeply: it is \(1.309\) at \(\epsilon = -1\) and \(0.038\) at \(\epsilon = 1\), a ratio of about \(35\).
Claims that pay in bad states are therefore expensive, which is why capital carries a large risk premium in Exercise 48.2.
With \(\chi_2 = -0.9\), agent 2’s endowment is high when \(\epsilon\) is low and output is high when \(\epsilon\) is high, so aggregate consumption is high at both ends: the discount factor is hump-shaped, \(0.140\) at \(\epsilon = -1\), \(0.323\) at \(\epsilon = 0\) and \(0.152\) at \(\epsilon = 1\).
The Arrow price density \(q(\epsilon;K)\) multiplies the discount factor by the normal density \(g(\epsilon)\), so it is single-peaked in both cases; its peak is near \(\epsilon = -0.28\) when \(\chi_2 = 0.9\) but near \(\epsilon = -0.01\) (close to \(\mu\)) when \(\chi_2 = -0.9\).